A must watch! This is a good education on Bitcoin and crypto -vs- fiat currency in general.
Update
See these interviews also by Lex Fridman…
See these interviews also by Lex Fridman…

Having an ‘edge’ and surviving are two different things: the first requires the second. You need to avoid ruin. At all costs.” – Nassim Taleb
The following are the handmade slides from the class. Well all but the last one on valuation.


See the trading category on this site for more information on trading and investing on this site…
http://erick.heart-centered-living.org/trading/
Also, the following are resources that were mentioned in the class. Good places to start on the path to learning more about investing and crypto as well…
Subject: Game of Trades at 14:08:10, Mon Nov 15, 2021 from 192.168.1.66
Subject: The Crypto Sniper at 14:05:40, Mon Nov 15, 2021 from 192.168.1.66
Subject: Brave New Coin at 14:04:54, Mon Nov 15, 2021 from 192.168.1.66
Subject: Josh Olszewicz at 14:03:59, Mon Nov 15, 2021 from 192.168.1.66
Subject: ARK Invest at 14:02:21, Mon Nov 15, 2021 from 192.168.1.66
Subject: Breaking Bad Fat Stacks at 13:45:44, Mon Nov 15, 2021 from 192.168.1.66
Subject: Electrum Wallet at 17:49:48, Sun Nov 14, 2021 from 192.168.1.66
Subject: 1964 Prices at 11:14:49, Sun Nov 14, 2021 from 192.168.1.29
https://www.reference.com/history/much-did-everyday-items-cost-1964-cfba9fcd6734ea4f https://misterboomer.com/2014/04/boomers-and-the-cost-of-living-in-1964/ http://www.348-409.com/1964flash.html
Subject: Silver Coin Value Guide at 11:11:02, Sun Nov 14, 2021 from 192.168.1.29
A class on crypto would not be complete without showing some crazy price moves that are only possible in the crypto world.


This post is an addition to the series on DMAC algorithm trading, which is simple algo trading example. I was wondering now that the S&P500 and etc, legacy market has dropped out of it’s long bull run, how would Bitcoin gains compare against the stock market?
First Post in Series to Learn More Background
Code to run this model on Github
The plan: Comparing Bitcoin (BTC) gains from January 1,2010 to December 31,2019 against the bottom for stocks on March 9, 2009 to Feb 19,2020, the 400% bull run for the S&P 500. But, for some reason the Yahoo data for Bitcoin is only going back to 2014-09-16. So we are basically getting a bit short changed here on BTC and giving the S&P a long head start for nearly 5 years. (I am sure at one point in the past, I think this used to work and go back all the way to 2010 but Yahoo must have cutoff the data since I first tried this code.)
So with 5 years head start for S&P
S&P500 4x gain across history shown in the above chart 03-09-2009 to 2-19-2020
BTC 16.96x gain from 9-16-2014 to 2-19-2020
S&P 500 on 9-16-2014 closed at 1998.98
S&P 500 on 2-19-2020 closed at 3386.15
S&P 500 gain 1.69x from 9-16-2014 to 2-19-2020
So Bitcoin beats the S&P using by and hold across the same time frame by 10x.
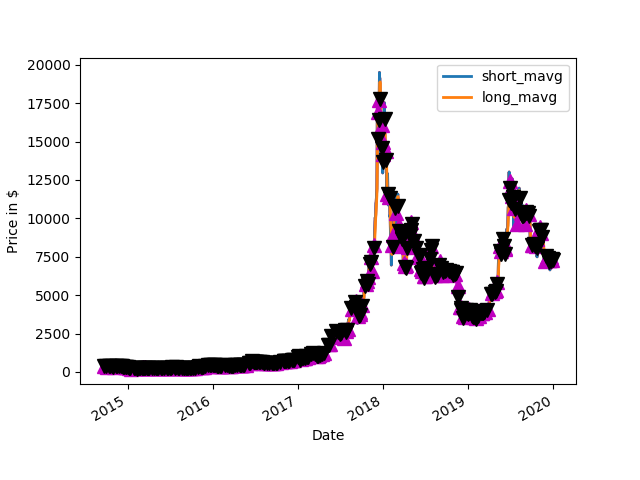
OK, now what about BTC HODL (Buy and Hold) gains versus optimized DMAC algorithm trading from 9-16-2014 to 2-19-2020?
HODL Gains: 16.96393901373665
Algo gains for a 1 day short and 4 day long average. This is wicked tight and it will trade like mad, so in real life, the transaction fees and slippage would eat away at this number after 10 years.
Short AVG,Long AVG,Best Bank 1 4 2244962.564086914 which is 22.4x
which is 22.4x gains. But, with fees/slippage and HODL at ~17x , HODL is really great. Beats the 4x or 1.69x depending on the time frame of the S&P 500!
This is a simple algorithm, one of the simplest ones that can be thought of. Also, remember that the algorithm only tuned once across the entire time period. If the time period was cut up into smaller periods and the algorithm learned the market as it changed over time instead of trying to get a best fit across 5 years it would have produced more gains. The example the initial post which has it trade from Jan 1 to Dec 31 of 2019 shows in making 900K alone in one year. So an algorithm that could in theory re-optimize periodically as the market conditions change would easily beat the results of this simple algorithm. The best thing that I can think of would be a machine learning algorithm that would use differential evolution to change the parameters as time goes on. It would learn on an ensemble of random sections of random lengths of data from the past and tune the algorithm’s parameters based on learning from the data ensembles. That is just one way that comes to mind.
But, at the end of the day this is just an example. It is not always possible to predict future results from past data. It is also well known and Covid-19, The Great Recession and Black Monday in 1987 serve as examples, there will be price shocks that can upend any model in practice. The statistics of price action do not fall neatly under a bell curve but have fat tails that lead to excursions far away from the mean on occasion. One only has to look to history for this lesson and one example is the firm Long-Term Capital Management (LTCM) led by a brilliant team of folks including Nobel prize winners Merton and Scholes, two out of the men that invented the Black-Scholes option pricing formula. Fischer Black, the other man was not alive at the time that the prize was awarded. Some credit for the formula rests with Ed Thorp as well, at least a way in the backstory. Ed Thorp had basically the same kind of formula running on convertible bonds, not a far jump to options pricing. This is all outlined in the great book The Quants by Scott Patterson. Quants was one of the seeds that led me to pursue trading, specifically algorithmic trading a few years after I read it.
So there were brilliant guys were at the heart of LTCM but, due to high leverage and a divergence of their models from reality when the Russian government defaulted on their debt, the firm crashed and burned financially. It happened fast as they and others holding similar positions in the market all simultaneously unwound those positions. LTCM was stuck holding a lot of positions trying to offload into a market without many buyers, low liquidity, and the worst part of it, being leveraged heavily 30-40:1 was the real problem. They were effectively running backwards selling off, what normally one would not want to be forced to sell off, being highly leveraged it quickly ran out of margin and went effectively bankrupt. The pieces of LTCM were bought up by 13 banks and this averted a disaster that could have been equal to 2008 if the banks had not carved up the LTCM carcass among themselves. It could have easily had a domino effect on the rest of the banks and the global market much like what happened in 2008. LTCM as brilliant as it began, ended as a good lesson for the future, if only heeded and rocked the markets for a while and the shock cascaded. Then the lesson seems to get lost in general, although I imagine some took it to heart, in general history repeated itself about a decade later in terms of the next financial crisis which was the same thing only an order of magnitude larger. 2008 was not containable by some short term heroics between the Fed and 13 banks as in the case of LTCM.
https://www.pbs.org/wgbh/nova/transcripts/2704stockmarket.html
https://www.pbs.org/wgbh/nova/stockmarket/
https://www.pbs.org/wgbh/pages/frontline/warning/themes/ltcm.html
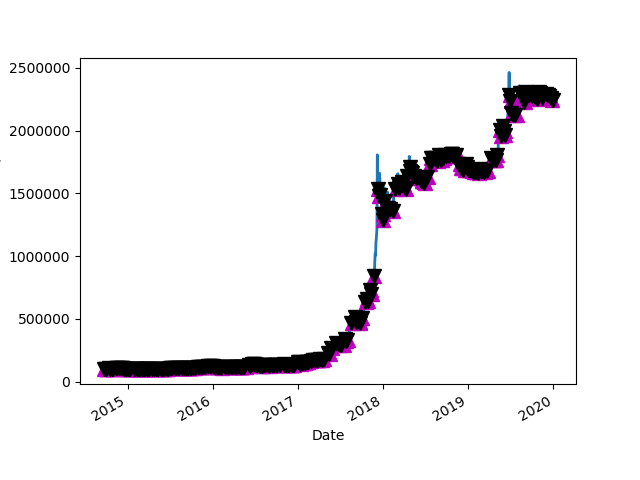
(base) erick@OptiPlex-790 ~/python/simple-strat $ python simple-strat-loop-backtest-2010-2019.py
Get Data
Run Model
Short AVG,Long AVG,Best Bank 1 1 100000.0
Short AVG,Long AVG,Best Bank 1 2 1495120.7946777344
Short AVG,Long AVG,Best Bank 1 3 1845316.8991088867
Short AVG,Long AVG,Best Bank 1 4 2244962.564086914
 signal short_mavg long_mavg positions
Date
2014-09-16 0.0 457.334015 457.334015 NaN
2014-09-17 0.0 424.440002 440.887009 0.0
2014-09-18 0.0 394.795990 425.523336 0.0
2014-09-19 0.0 408.903992 421.368500 0.0
2014-09-20 0.0 398.821014 406.740250 0.0
2014-09-21 1.0 402.152008 401.168251 1.0
2014-09-22 1.0 435.790985 411.417000 0.0
2014-09-23 1.0 423.204987 414.992249 0.0
2014-09-24 0.0 411.574005 418.180496 -1.0
2014-09-25 0.0 404.424988 418.748741 0.0
2014-09-26 0.0 399.519989 409.680992 0.0
2014-09-27 0.0 377.181000 398.174995 0.0
2014-09-28 0.0 375.467010 389.148247 0.0
2014-09-29 1.0 386.944000 384.778000 1.0
2014-09-30 1.0 383.614990 380.801750 0.0
2014-10-01 0.0 375.071991 380.274498 -1.0
2014-10-02 0.0 359.511993 376.285744 0.0
2014-10-03 0.0 328.865997 361.766243 0.0
2014-10-04 0.0 320.510010 345.989998 0.0
2014-10-05 0.0 330.079010 334.741753 0.0
2014-10-06 1.0 336.187012 328.910507 1.0
2014-10-07 1.0 352.940002 334.929008 0.0
2014-10-08 1.0 365.026001 346.058006 0.0
2014-10-09 1.0 361.562012 353.928757 0.0
2014-10-10 1.0 362.299011 360.456757 0.0
2014-10-11 1.0 378.549011 366.859009 0.0
2014-10-12 1.0 390.414001 373.206009 0.0
2014-10-13 1.0 400.869995 383.033005 0.0
2014-10-14 1.0 394.773010 391.151505 0.0
2014-10-15 0.0 382.556000 392.153252 -1.0
... ... ... ... ...
2019-12-03 0.0 7320.145508 7409.014038 0.0
2019-12-04 0.0 7252.034668 7329.615234 0.0
2019-12-05 1.0 7448.307617 7335.619019 1.0
2019-12-06 1.0 7546.996582 7391.871094 0.0
2019-12-07 1.0 7556.237793 7450.894165 0.0
2019-12-08 1.0 7564.345215 7528.971802 0.0
2019-12-09 0.0 7400.899414 7517.119751 -1.0
2019-12-10 0.0 7278.119629 7449.900513 0.0
2019-12-11 0.0 7217.427246 7365.197876 0.0
2019-12-12 0.0 7243.134277 7284.895142 0.0
2019-12-13 1.0 7269.684570 7252.091431 1.0
2019-12-14 0.0 7124.673828 7213.729980 -1.0
2019-12-15 0.0 7152.301758 7197.448608 0.0
2019-12-16 0.0 6932.480469 7119.785156 0.0
2019-12-17 0.0 6640.515137 6962.492798 0.0
2019-12-18 1.0 7276.802734 7000.525024 1.0
2019-12-19 1.0 7202.844238 7013.160645 0.0
2019-12-20 1.0 7218.816406 7084.744629 0.0
2019-12-21 0.0 7191.158691 7222.405518 -1.0
2019-12-22 1.0 7511.588867 7281.102051 1.0
2019-12-23 1.0 7355.628418 7319.298096 0.0
2019-12-24 0.0 7322.532227 7345.227051 -1.0
2019-12-25 0.0 7275.155762 7366.226318 0.0
2019-12-26 0.0 7238.966797 7298.070801 0.0
2019-12-27 1.0 7290.088379 7281.685791 1.0
2019-12-28 1.0 7317.990234 7280.550293 0.0
2019-12-29 1.0 7422.652832 7317.424561 0.0
2019-12-30 0.0 7292.995117 7330.931641 -1.0
2019-12-31 0.0 7193.599121 7306.809326 0.0
2020-01-01 0.0 7200.174316 7277.355347 0.0

[1933 rows x 4 columns]
 BTC-USD holdings cash total returns
Date
2014-09-16 0.0 0.0 100000.0 100000.0 NaN
2014-09-17 0.0 0.0 100000.0 100000.0 0.0
2014-09-18 0.0 0.0 100000.0 100000.0 0.0
2014-09-19 0.0 0.0 100000.0 100000.0 0.0
2014-09-20 0.0 0.0 100000.0 100000.0 0.0
 BTC-USD holdings cash total returns
Date
2019-12-28 731799.023438 731799.023438 1.515663e+06 2.247462e+06 0.001243
2019-12-29 742265.283203 742265.283203 1.515663e+06 2.257928e+06 0.004657
2019-12-30 0.000000 0.000000 2.244963e+06 2.244963e+06 -0.005742
2019-12-31 0.000000 0.000000 2.244963e+06 2.244963e+06 0.000000
2020-01-01 0.000000 0.000000 2.244963e+06 2.244963e+06 0.000000
Portfolio Plot
Sharpe Ratio 1.5767602439593071
Compound Annual Growth Rate (CAGR) 0.7067353770154898
HODL Gains: 16.96393901373665

Speculation in stocks will never disappear. It isn’t desirable that it should. It cannot be checked by warnings as to its dangers. You cannot prevent people from guessing wrong no matter how able or how experienced they may be. Carefully laid plans will miscarry because the unexpected and even the unexpectable will happen. Disaster may come from a convulsion of nature or from the weather, from your own greed or from some man’s vanity; from fear or from uncontrolled hope. – Reminiscences of a Stock Operator
I have some good books in the list. The ones that cover the psychological aspects of trading are worth the time to read if you have gotten past the basics of trading. It helps if you have traded a little at least to have some hands on experience with it. Best to start out with a few hundred dollars and build up the account as you get the hang of trading. Adding to the account slowly. I wish I had read these books in the beginning, just when I was trying the first half dozen trades, at the same time that I was learning about the technical aspects of trading.
Subject: Road less traveled M. Scott Peck
https://www.apnamba.com/Ebooks-pdf/The%20Road%20Less%20Traveled.pdf
The first section on discipline is a good read for the psychology of trading. Think discipline in terms of trading.
Subject: Technical Analysis (TA) of financial markets John Murphy
Classic TA book. This along with Perry J. Kaufman’s book New Trading Systems and Methods will be good references for the nuts and bolts of trading.
Subject: Another TA Book, Open Source
This book is a good reference book. It compiles a lot of information that is in the public domain, mostly via Wikipedia in one place. At the end of each chapter there are good notes, references and further reading. It is good to have this on hand when you want to look something up quick or for beginners to get an overview of technical analysis.
In the Markets: Confessions of a Samurai Trader Edward Alan Toppel
Worth a read, especially for anyone that has been exposed to Asian culture. It still makes sense if you’re not familiar with the culture but, if you are it’s going to be a deeper read.
Confessions of a Samurai Trader Ebook https://www.forexfactory.com/attachment.php/2566801?attachmentid=2566801&d=1510983772
Trading for a living by Elder Alexander
Very good, Elder Alexander is a Psychologist turned trader. He is also the inventor of the Triple Screen Trading System, which is outlined in the book.
This is in download PDF http://www.saham-indonesia.com/Ebooks/Technical%20Analysis/Elder%20Alexander%20-%20Trading%20For%20A%20Living.pdf
Reminiscences of a Stock Operator Book by Edwin Lefèvre Zen
There is nothing like losing all you have in the world for teaching you what not to do. And when you know what not to do in order not to lose money, you begin to learn what to do in order to win. Did you get that? You begin to learn!
Very good, a must read! This book is supposedly handed out to new employees at Goldman Sachs to read as a first assignment. I can see why, it really is an eyeopener. It is a book I wished that I had read right in the beginning of starting to consider trading myself.
While not necessarily for trading, it’s helpful to have a broad selection of different types of knowledge in your latticework of the mind as Charlie Munger calls it. In case you didn’t know, Charlie Munger is Warren Buffet’s right hand man at Berkshire Hathaway.
This table of contents is what got my attention with this book. I was a bit caught of guard at first with the topics and the connection they might make to investing. But, a short skim confirmed the author was right on target with all of the topics covered.

I didn ’t know what to think of this book when I first saw it. But, it’s different from most investing books in a good way. It’s more about building a mindset, a latticework in your mind to pull from to better think about investing. Clearly, knowing other subjects beyond economics and finance are helpful to have a background of general knowledge to be able to pull ideas from. For me, I agree as this has been my own experience. This book went from one that I was skeptical about to a favorite after a few chapters.Initially the chapter titles caught my attention, as they were unlike any ones that I have seen in other investing books.
Originally from 1890, it’s a classic. It’s still used in some college curriculums today. This book can provide a background on economics. With trading, you need to be able to understand the view from above as well. Understanding how economics works provides a high altitude view from far above the landscape of fundamentals and technical analysis. It’s important to a least have some understanding of the bigger picture, a macro view of economics from the beginning when you trade.
This is the 8th edition of what is regarded to be the first “modern” economics textbook, leading in various editions from the 19th into the 20th century. The final 8th edition was Marshall’s most-used and most-cited.
http://files.libertyfund.org/files/1676/Marshall_0197_EBk_v6.0.pdf

There are many thousands of people who buy and sell stocks speculatively but the number of those who speculate profitably is small. As the public always is “in” the market to some extent, it follows that there are losses by the public all the time. The speculator’s deadly enemies are: Ignorance, greed, fear and hope. All the statute books in the world and all the rules of all the Exchanges on earth cannot eliminate these from the human animal. Accidents which knock carefully conceived plans skyhigh also are beyond regulation by bodies of coldblooded economists or warm-hearted philanthropists.– Reminiscences of a Stock Operator
The following post contains video resources. Some of this material especially the material from Francis Hunt and David Paul on the psychology and mindset of trading is quite important. It is best to learn about the psychology and mindset of trading while learning other typical trading topics such as technical analysis and fundamentals. It is just as important in the long run and having discipline and the right mindset goes a long way to preventing losses and maximizing gains over the long haul.
Josh Olszewicz produces market updates on a regular basis cover BTC and ETH primarily. Plenty to learn from and in my opinion, reliable insights.
https://www.youtube.com/channel/UC587BAG9cLTYtJ7Q4CqcOnw
Francis Hunt produces periodic crypto market updates and actually trades in legacy markets as well and provides useful insights from both realms and also currencies plus gold and silver.
https://www.youtube.com/channel/UCdC4a2KquFV1F4O21mW3K7g
He is a professor, so get ready to study. Many videos on his channel. A few updates here and there but , most of it is in depth college level training on topics such as valuation and analyzing the fundamentals of companies. Good information for a background on the stock market. Plenty of videos to pick and choose from as you want to dive into a specific topic.
https://www.youtube.com/channel/UCLvnJL8htRR1T9cbSccaoVw
Basics. Well done videos, most of them nice and short and covering specific topics. Everything that applies to spreadbetting can be applied to trading as well so don’t let the name fool you.
https://www.youtube.com/channel/UCnKPQUoCRb1Vu-qWwWituGQ
Basics. Watched a few videos off of this channel a bit of overlap with UKspreadbetting but short concise videos. Worth looking at.
https://www.youtube.com/channel/UCfWQuGYMfhZk9qq5x00sb9w
Especially these two in the series are very important…
Trading Secrets of the Mind Master the Emotional Side of Trading
Improving the Mindset Game in our Trading
https://www.youtube.com/watch?v=MGglyvc8d58&list=WL&index=113&t=0s
Subject: David Paul Tips from video
Asset above 89 day MA. Market above 21 day MA And rising , will get hit rate to 80 Probability matrix Pattern to finesse entry . 1-2 pct at risk per trade. Plan and repeated perfect execution. Build neural pathways after 8-30 trades…….. William O’Neil How to make money in stocks……from The Psychology of trading and investing
Not trading information specifically but, he is a legend. Mathematician, code breaker turned trading genius. He co-founded Renaissance Technologies in East Setauket, New York, a town away from where I grew up. Renaissance Technologies, Ren Tech, makes huge yearly gains in it’s Medallion Fund. The company does a lot of quant work and hires PhD scientists, mathematicians and etc. Working for this company would be amazing to say the least. So much to learn there working with the talented people he has helped to pick and shape over the years.
Renaissance’s flagship Medallion fund, which is run mostly for fund employees,[8] is famed for the best track record on Wall Street, returning more than 66 percent annualized before fees and 39 percent after fees over a 30-year span from 1988 to 2018.[9][10]
I got this example originally called simple-strat.py from a Datacamp article . I have my changes to the code up on Github.
Basically the modifications to the original code incorporates a Dual Moving Average Crossover (DMAC) strategy that adjusts the averages to pick optimum values . DMAC is a very basic trend trading strategy. Other types of strategies would include, mean reversion, hedging such as pairs trading, arbitrage or buying and selling across the bid-ask spread as a market maker, so called earning the spread.
A dual moving crossover is exactly what the name says. There are two moving averages, one short and one long. When the short one rises above the long one, it is a buy signal. When they cross the other way, guess what, sell. This is almost about as dirt simple as a strategy can get. Single moving average, where price crosses one average would be the simplest moving average strategy. DMAC used in the example is not fancy at all, no stops, no screening, no failure mode protections. I have found that about 10% of designing a good algorithmic strategy is in the strategy, another 10-20% is in the tuning and generalizing, backtesting. The rest is protecting the strategy from itself, such as screening out bad trades. The absolute worst is price shocks, which can’t be predicted.
Initially it was coded to work with stocks but, I revised it to take in BTC instead. I also took it one level up and had it automatically tune for the best combinations of the short and long average for the DMAC stratagy. This is a bit better than sitting there and fiddling the parameters by hand. The pitfall is that the model can be overfit to the backtest data and then perform poorly on new data. It is best to have a model that generalizes a bit. Sometimes this can be accomplished by actually dumbing the process down a bit or using a stochastic approach. More parameters in the model the more likely overfit will occur as well.
One approach that I typically use when tuning an algorithmic models parameters is to use an ensemble approach. I have used this successfully with genetic algos, such as differential evolution. I will have the backtest tuning take random slices of the time series from random points within the time series. From this I will run backtests on each one and then average the results together to form the ensemble. This helps to generalize but, won’t work for every kind of model. This has to do with the nature of local maxima and minima that the model might rise up to or fall into. With some models averaging may just average to the plain and not the peaks and valleys. This has to be looked at carefully. But, I am getting off topic here.
The idea here is to do some Monday morning quarterbacking. When I was in industry this was always a thing on Mondays. No matter what the sport, everyone threw around the coulda, woulda, shouldas. Probably more so if there was money riding on the game. Well if you are a trader or investor, there is real money riding on the game so sometimes it is worth looking back and seeing how a trading strategy would have worked against the classic long term buy and hold. a.k.a HODL…hold on for dear life.
If any of the terminology or details above seem fuzzy, check out the Datacamp article.
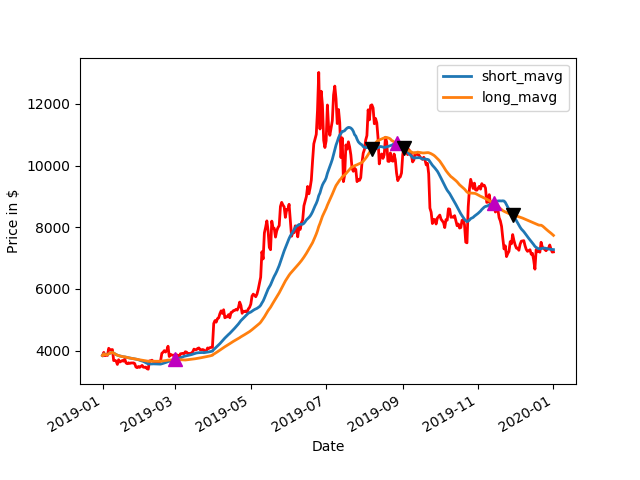
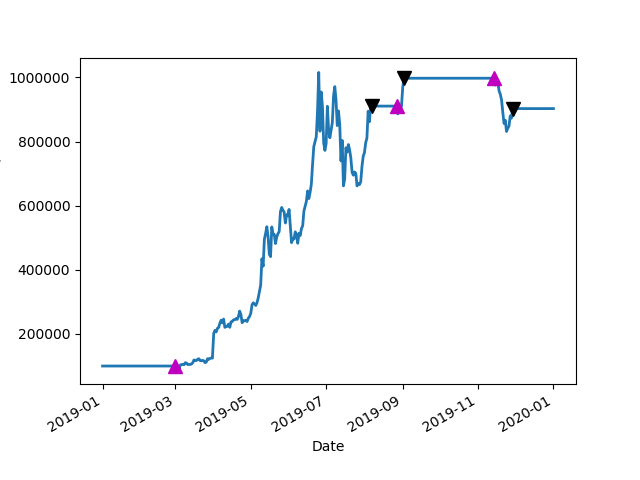
If we bought BTC on 1/1/2019 and sold on 12/31/2019 and had a magic wand to make the perfect DMAC tuned model, would we have done better than buy and hold?
We start with $100K on 1/1/2019 and cash out on 12/31. What do we have?
DMAC with a 29 day short and 59 day long average…
Short AVG,Long AVG,Best Bank 29 59 902908.9599609375
$900K, the clear winner.
Buy and Hold comes in at $182K
HODL Gains: 1.8258754145331861
Obviously, this is perfect trades, like a Carnot cycle engine without friction, it’s not realistic . In the real world there are fees, slippages, price shocks, picking bad parameters and other gotchas.
But, even if you threw a dart at pairs of numbers for the averages, at least for 2019, odds are the DMAC would have beat buy and hold for the year. This is not always the case, as in years past a buy and hold would have beat the DMAC. See the printout here for a 2010-2017 run.
output from simple-strat-loop-backtest-2019.py
Get Data
Run Model
Short AVG,Long AVG,Best Bank 1 1 100000.0
Short AVG,Long AVG,Best Bank 1 2 611522.802734375
Short AVG,Long AVG,Best Bank 1 4 646585.4736328125
Short AVG,Long AVG,Best Bank 1 16 652523.6328125
Short AVG,Long AVG,Best Bank 1 17 689456.2744140625
Short AVG,Long AVG,Best Bank 3 89 690951.904296875
Short AVG,Long AVG,Best Bank 4 90 696133.9599609375
Short AVG,Long AVG,Best Bank 6 86 707596.8994140625
Short AVG,Long AVG,Best Bank 9 82 709683.1787109375
Short AVG,Long AVG,Best Bank 9 83 732913.4521484375
Short AVG,Long AVG,Best Bank 10 83 742904.150390625
Short AVG,Long AVG,Best Bank 13 17 746094.677734375
Short AVG,Long AVG,Best Bank 14 81 762164.5263671875
Short AVG,Long AVG,Best Bank 22 95 781311.2548828125
Short AVG,Long AVG,Best Bank 27 55 814494.62890625
Short AVG,Long AVG,Best Bank 29 56 820056.7626953125
Short AVG,Long AVG,Best Bank 29 57 886127.4658203125
Short AVG,Long AVG,Best Bank 29 59 902908.9599609375
signal short_mavg long_mavg positions
Date
2019-01-01 0.0 3843.520020 3843.520020 NaN
2019-01-02 0.0 3893.464722 3893.464722 0.0
2019-01-03 0.0 3874.556885 3874.556885 0.0
2019-01-04 0.0 3870.347046 3870.347046 0.0
2019-01-05 0.0 3865.316553 3865.316553 0.0
2019-01-06 0.0 3900.535889 3900.535889 0.0
2019-01-07 0.0 3918.351946 3918.351946 0.0
2019-01-08 0.0 3932.413940 3932.413940 0.0
2019-01-09 0.0 3943.845323 3943.845323 0.0
2019-01-10 0.0 3917.353247 3917.353247 0.0
2019-01-11 0.0 3896.445268 3896.445268 0.0
2019-01-12 0.0 3876.849915 3876.849915 0.0
2019-01-13 0.0 3851.934777 3851.934777 0.0
2019-01-14 0.0 3841.514596 3841.514596 0.0
2019-01-15 0.0 3827.458643 3827.458643 0.0
2019-01-16 0.0 3816.680405 3816.680405 0.0
2019-01-17 0.0 3808.555908 3808.555908 0.0
2019-01-18 0.0 3800.182766 3800.182766 0.0
2019-01-19 0.0 3796.413587 3796.413587 0.0
2019-01-20 0.0 3786.643591 3786.643591 0.0
2019-01-21 0.0 3776.614490 3776.614490 0.0
2019-01-22 0.0 3768.794611 3768.794611 0.0
2019-01-23 0.0 3760.808891 3760.808891 0.0
2019-01-24 0.0 3754.144582 3754.144582 0.0
2019-01-25 0.0 3747.969434 3747.969434 0.0
2019-01-26 0.0 3742.372934 3742.372934 0.0
2019-01-27 0.0 3736.506004 3736.506004 0.0
2019-01-28 0.0 3727.004020 3727.004020 0.0
2019-01-29 0.0 3717.387224 3717.387224 0.0
2019-01-30 0.0 3705.065211 3709.680371 0.0
… … … … …
2019-12-03 0.0 8139.303778 8350.672074 0.0
2019-12-04 0.0 8067.217824 8338.195445 0.0
2019-12-05 0.0 8001.267056 8324.681624 0.0
2019-12-06 0.0 7941.937231 8313.125919 0.0
2019-12-07 0.0 7898.880573 8295.507233 0.0
2019-12-08 0.0 7855.803442 8278.183023 0.0
2019-12-09 0.0 7798.747340 8262.575270 0.0
2019-12-10 0.0 7747.724289 8244.635676 0.0
2019-12-11 0.0 7692.612742 8225.930954 0.0
2019-12-12 0.0 7638.642797 8206.752102 0.0
2019-12-13 0.0 7589.042447 8190.893042 0.0
2019-12-14 0.0 7541.893538 8175.251465 0.0
2019-12-15 0.0 7493.670814 8159.122492 0.0
2019-12-16 0.0 7436.929603 8141.483051 0.0
2019-12-17 0.0 7379.385776 8118.634824 0.0
2019-12-18 0.0 7347.339473 8102.613207 0.0
2019-12-19 0.0 7318.911065 8084.971233 0.0
2019-12-20 0.0 7304.292666 8070.405356 0.0
2019-12-21 0.0 7300.657530 8064.922082 0.0
2019-12-22 0.0 7304.581391 8065.228863 0.0
2019-12-23 0.0 7315.192130 8043.109003 0.0
2019-12-24 0.0 7321.274835 8010.525266 0.0
2019-12-25 0.0 7323.232927 7971.939519 0.0
2019-12-26 0.0 7313.139935 7937.750000 0.0
2019-12-27 0.0 7307.173811 7901.519506 0.0
2019-12-28 0.0 7291.889211 7869.523975 0.0
2019-12-29 0.0 7286.821037 7839.406482 0.0
2019-12-30 0.0 7282.293541 7806.048696 0.0
2019-12-31 0.0 7277.866329 7769.928041 0.0
2020-01-01 0.0 7273.729391 7735.433461 0.0
[366 rows x 4 columns]
BTC-USD holdings cash total returns
Date
2019-01-01 0.0 0.0 100000.0 100000.0 NaN
2019-01-02 0.0 0.0 100000.0 100000.0 0.0
2019-01-03 0.0 0.0 100000.0 100000.0 0.0
2019-01-04 0.0 0.0 100000.0 100000.0 0.0
2019-01-05 0.0 0.0 100000.0 100000.0 0.0
BTC-USD holdings cash total returns
Date
2019-12-28 0.0 0.0 902908.959961 902908.959961 0.0
2019-12-29 0.0 0.0 902908.959961 902908.959961 0.0
2019-12-30 0.0 0.0 902908.959961 902908.959961 0.0
2019-12-31 0.0 0.0 902908.959961 902908.959961 0.0
2020-01-01 0.0 0.0 902908.959961 902908.959961 0.0
Portfolio Plot
Sharpe Ratio 2.2316038135122973
Compound Annual Growth Rate (CAGR) 0.8258754145331861
HODL Gains: 1.8258754145331861
Followup, I was curious about the rough 2018 year for BTC. 2018 was quite bearish, with only a few small rallies up. It had awful buy and hold performance.
HODL Gains: 0.2565408133534354
Short AVG,Long AVG,Best Bank 1 4 498855.46875
Buy and hold would have been a 4x loss and DMAC would have traded in and out quite often, racking up some fees and slippage of course but, made a 5X gain.
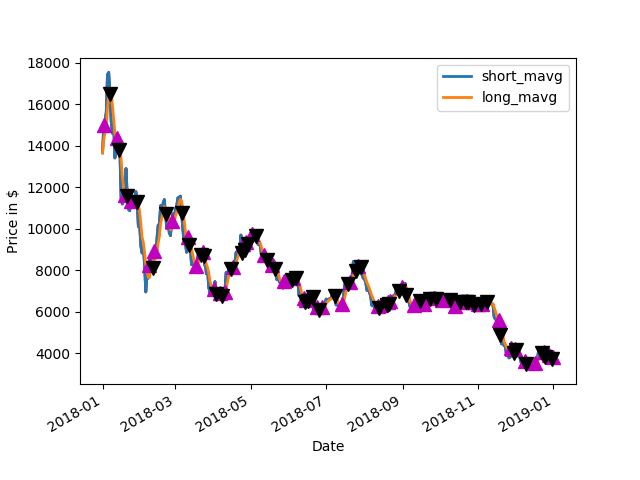
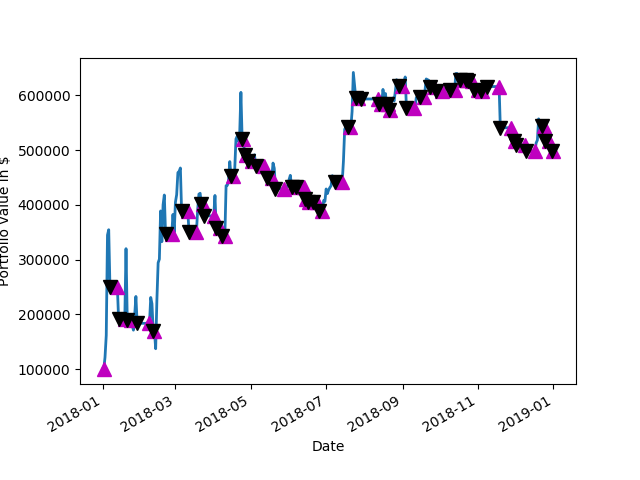
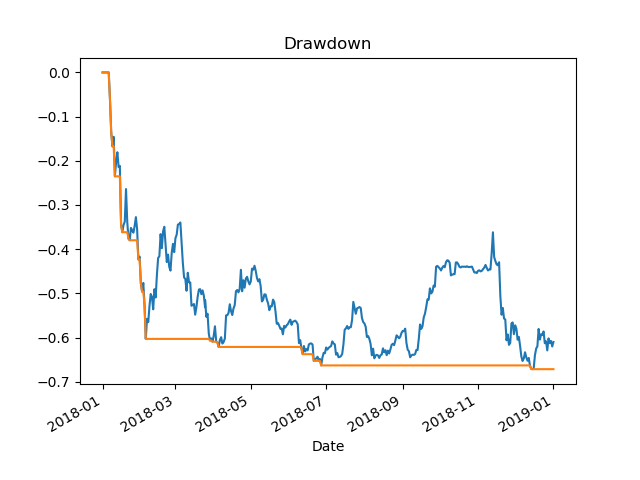
2018 Results Details on Github
https://github.com/erickclasen/DMAC-BTC-Trading-Example-With-Tuning