I got this example originally called simple-strat.py from a Datacamp article . I have my changes to the code up on Github.
Tunable DMAC
Basically the modifications to the original code incorporates a Dual Moving Average Crossover (DMAC) strategy that adjusts the averages to pick optimum values . DMAC is a very basic trend trading strategy. Other types of strategies would include, mean reversion, hedging such as pairs trading, arbitrage or buying and selling across the bid-ask spread as a market maker, so called earning the spread.
DMAC Basics
A dual moving crossover is exactly what the name says. There are two moving averages, one short and one long. When the short one rises above the long one, it is a buy signal. When they cross the other way, guess what, sell. This is almost about as dirt simple as a strategy can get. Single moving average, where price crosses one average would be the simplest moving average strategy. DMAC used in the example is not fancy at all, no stops, no screening, no failure mode protections. I have found that about 10% of designing a good algorithmic strategy is in the strategy, another 10-20% is in the tuning and generalizing, backtesting. The rest is protecting the strategy from itself, such as screening out bad trades. The absolute worst is price shocks, which can’t be predicted.
Tuning
Initially it was coded to work with stocks but, I revised it to take in BTC instead. I also took it one level up and had it automatically tune for the best combinations of the short and long average for the DMAC stratagy. This is a bit better than sitting there and fiddling the parameters by hand. The pitfall is that the model can be overfit to the backtest data and then perform poorly on new data. It is best to have a model that generalizes a bit. Sometimes this can be accomplished by actually dumbing the process down a bit or using a stochastic approach. More parameters in the model the more likely overfit will occur as well.
Aside on Ensemble Backtesting
One approach that I typically use when tuning an algorithmic models parameters is to use an ensemble approach. I have used this successfully with genetic algos, such as differential evolution. I will have the backtest tuning take random slices of the time series from random points within the time series. From this I will run backtests on each one and then average the results together to form the ensemble. This helps to generalize but, won’t work for every kind of model. This has to do with the nature of local maxima and minima that the model might rise up to or fall into. With some models averaging may just average to the plain and not the peaks and valleys. This has to be looked at carefully. But, I am getting off topic here.
DMAC versus Buy and Hold
The idea here is to do some Monday morning quarterbacking. When I was in industry this was always a thing on Mondays. No matter what the sport, everyone threw around the coulda, woulda, shouldas. Probably more so if there was money riding on the game. Well if you are a trader or investor, there is real money riding on the game so sometimes it is worth looking back and seeing how a trading strategy would have worked against the classic long term buy and hold. a.k.a HODL…hold on for dear life.
If any of the terminology or details above seem fuzzy, check out the Datacamp article.
Fantasy Account
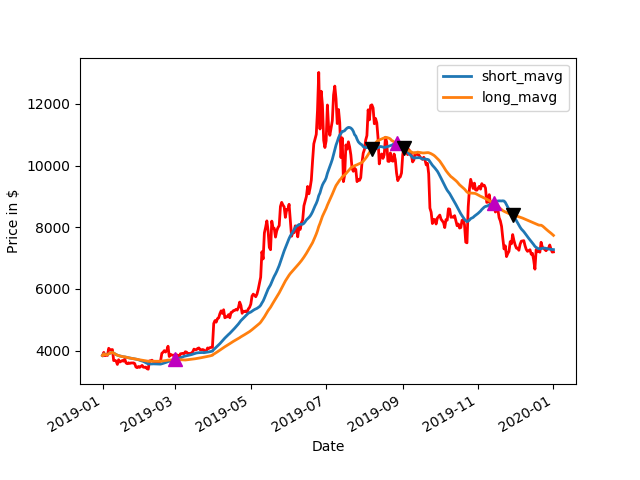
If we bought BTC on 1/1/2019 and sold on 12/31/2019 and had a magic wand to make the perfect DMAC tuned model, would we have done better than buy and hold?
We start with $100K on 1/1/2019 and cash out on 12/31. What do we have?
DMAC with a 29 day short and 59 day long average…
Short AVG,Long AVG,Best Bank 29 59 902908.9599609375
$900K, the clear winner.
Buy and Hold comes in at $182K
HODL Gains: 1.8258754145331861
Obviously, this is perfect trades, like a Carnot cycle engine without friction, it’s not realistic . In the real world there are fees, slippages, price shocks, picking bad parameters and other gotchas.
But, even if you threw a dart at pairs of numbers for the averages, at least for 2019, odds are the DMAC would have beat buy and hold for the year. This is not always the case, as in years past a buy and hold would have beat the DMAC. See the printout here for a 2010-2017 run.
output from simple-strat-loop-backtest-2019.py
Get Data
Run Model
Short AVG,Long AVG,Best Bank 1 1 100000.0
Short AVG,Long AVG,Best Bank 1 2 611522.802734375
Short AVG,Long AVG,Best Bank 1 4 646585.4736328125
Short AVG,Long AVG,Best Bank 1 16 652523.6328125
Short AVG,Long AVG,Best Bank 1 17 689456.2744140625
Short AVG,Long AVG,Best Bank 3 89 690951.904296875
Short AVG,Long AVG,Best Bank 4 90 696133.9599609375
Short AVG,Long AVG,Best Bank 6 86 707596.8994140625
Short AVG,Long AVG,Best Bank 9 82 709683.1787109375
Short AVG,Long AVG,Best Bank 9 83 732913.4521484375
Short AVG,Long AVG,Best Bank 10 83 742904.150390625
Short AVG,Long AVG,Best Bank 13 17 746094.677734375
Short AVG,Long AVG,Best Bank 14 81 762164.5263671875
Short AVG,Long AVG,Best Bank 22 95 781311.2548828125
Short AVG,Long AVG,Best Bank 27 55 814494.62890625
Short AVG,Long AVG,Best Bank 29 56 820056.7626953125
Short AVG,Long AVG,Best Bank 29 57 886127.4658203125
Short AVG,Long AVG,Best Bank 29 59 902908.9599609375
signal short_mavg long_mavg positions
Date
2019-01-01 0.0 3843.520020 3843.520020 NaN
2019-01-02 0.0 3893.464722 3893.464722 0.0
2019-01-03 0.0 3874.556885 3874.556885 0.0
2019-01-04 0.0 3870.347046 3870.347046 0.0
2019-01-05 0.0 3865.316553 3865.316553 0.0
2019-01-06 0.0 3900.535889 3900.535889 0.0
2019-01-07 0.0 3918.351946 3918.351946 0.0
2019-01-08 0.0 3932.413940 3932.413940 0.0
2019-01-09 0.0 3943.845323 3943.845323 0.0
2019-01-10 0.0 3917.353247 3917.353247 0.0
2019-01-11 0.0 3896.445268 3896.445268 0.0
2019-01-12 0.0 3876.849915 3876.849915 0.0
2019-01-13 0.0 3851.934777 3851.934777 0.0
2019-01-14 0.0 3841.514596 3841.514596 0.0
2019-01-15 0.0 3827.458643 3827.458643 0.0
2019-01-16 0.0 3816.680405 3816.680405 0.0
2019-01-17 0.0 3808.555908 3808.555908 0.0
2019-01-18 0.0 3800.182766 3800.182766 0.0
2019-01-19 0.0 3796.413587 3796.413587 0.0
2019-01-20 0.0 3786.643591 3786.643591 0.0
2019-01-21 0.0 3776.614490 3776.614490 0.0
2019-01-22 0.0 3768.794611 3768.794611 0.0
2019-01-23 0.0 3760.808891 3760.808891 0.0
2019-01-24 0.0 3754.144582 3754.144582 0.0
2019-01-25 0.0 3747.969434 3747.969434 0.0
2019-01-26 0.0 3742.372934 3742.372934 0.0
2019-01-27 0.0 3736.506004 3736.506004 0.0
2019-01-28 0.0 3727.004020 3727.004020 0.0
2019-01-29 0.0 3717.387224 3717.387224 0.0
2019-01-30 0.0 3705.065211 3709.680371 0.0
… … … … …
2019-12-03 0.0 8139.303778 8350.672074 0.0
2019-12-04 0.0 8067.217824 8338.195445 0.0
2019-12-05 0.0 8001.267056 8324.681624 0.0
2019-12-06 0.0 7941.937231 8313.125919 0.0
2019-12-07 0.0 7898.880573 8295.507233 0.0
2019-12-08 0.0 7855.803442 8278.183023 0.0
2019-12-09 0.0 7798.747340 8262.575270 0.0
2019-12-10 0.0 7747.724289 8244.635676 0.0
2019-12-11 0.0 7692.612742 8225.930954 0.0
2019-12-12 0.0 7638.642797 8206.752102 0.0
2019-12-13 0.0 7589.042447 8190.893042 0.0
2019-12-14 0.0 7541.893538 8175.251465 0.0
2019-12-15 0.0 7493.670814 8159.122492 0.0
2019-12-16 0.0 7436.929603 8141.483051 0.0
2019-12-17 0.0 7379.385776 8118.634824 0.0
2019-12-18 0.0 7347.339473 8102.613207 0.0
2019-12-19 0.0 7318.911065 8084.971233 0.0
2019-12-20 0.0 7304.292666 8070.405356 0.0
2019-12-21 0.0 7300.657530 8064.922082 0.0
2019-12-22 0.0 7304.581391 8065.228863 0.0
2019-12-23 0.0 7315.192130 8043.109003 0.0
2019-12-24 0.0 7321.274835 8010.525266 0.0
2019-12-25 0.0 7323.232927 7971.939519 0.0
2019-12-26 0.0 7313.139935 7937.750000 0.0
2019-12-27 0.0 7307.173811 7901.519506 0.0
2019-12-28 0.0 7291.889211 7869.523975 0.0
2019-12-29 0.0 7286.821037 7839.406482 0.0
2019-12-30 0.0 7282.293541 7806.048696 0.0
2019-12-31 0.0 7277.866329 7769.928041 0.0
2020-01-01 0.0 7273.729391 7735.433461 0.0
[366 rows x 4 columns]
BTC-USD holdings cash total returns
Date
2019-01-01 0.0 0.0 100000.0 100000.0 NaN
2019-01-02 0.0 0.0 100000.0 100000.0 0.0
2019-01-03 0.0 0.0 100000.0 100000.0 0.0
2019-01-04 0.0 0.0 100000.0 100000.0 0.0
2019-01-05 0.0 0.0 100000.0 100000.0 0.0
BTC-USD holdings cash total returns
Date
2019-12-28 0.0 0.0 902908.959961 902908.959961 0.0
2019-12-29 0.0 0.0 902908.959961 902908.959961 0.0
2019-12-30 0.0 0.0 902908.959961 902908.959961 0.0
2019-12-31 0.0 0.0 902908.959961 902908.959961 0.0
2020-01-01 0.0 0.0 902908.959961 902908.959961 0.0
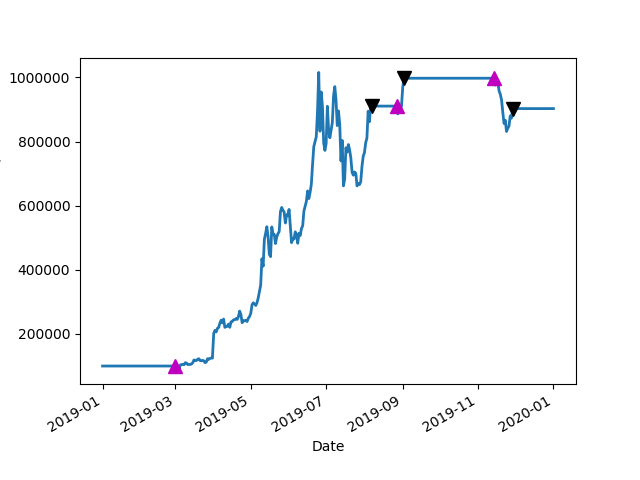
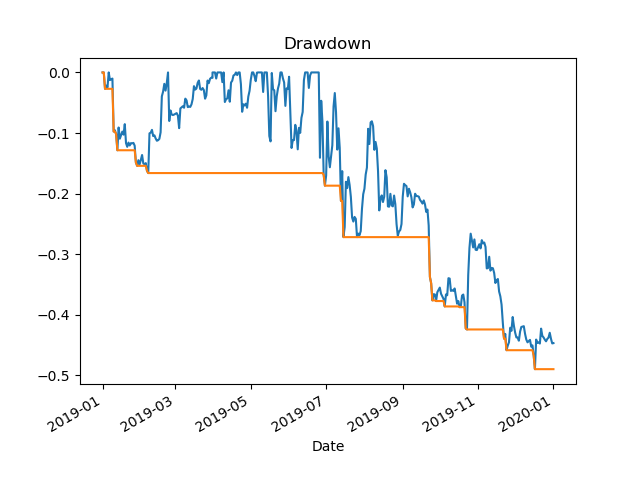
Portfolio Plot
Sharpe Ratio 2.2316038135122973
Compound Annual Growth Rate (CAGR) 0.8258754145331861
HODL Gains: 1.8258754145331861
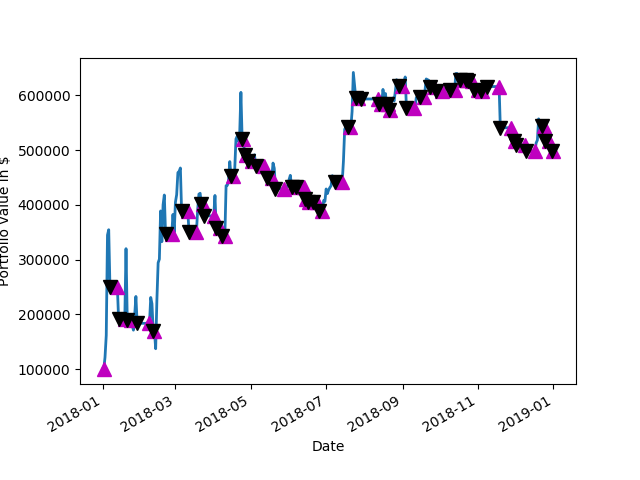
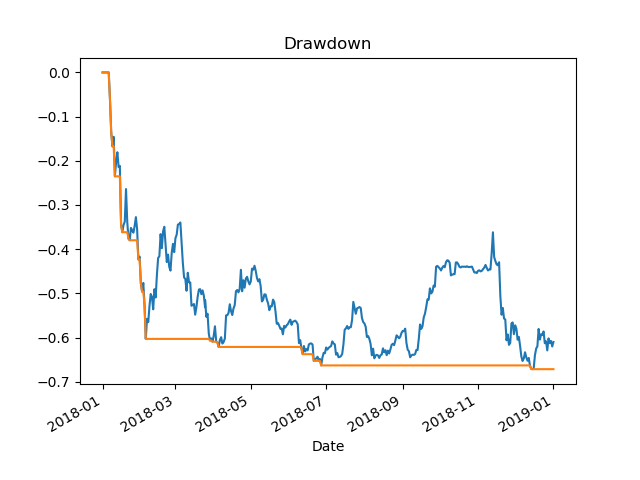
2018
Followup, I was curious about the rough 2018 year for BTC. 2018 was quite bearish, with only a few small rallies up. It had awful buy and hold performance.
HODL Gains: 0.2565408133534354
Short AVG,Long AVG,Best Bank 1 4 498855.46875
Buy and hold would have been a 4x loss and DMAC would have traded in and out quite often, racking up some fees and slippage of course but, made a 5X gain.
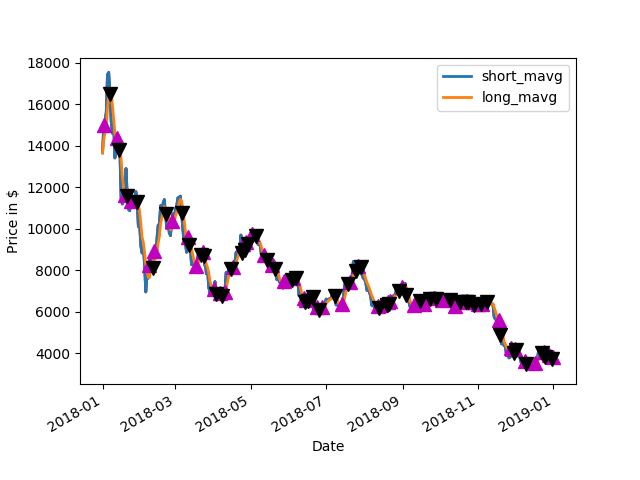
2018 Results Details on Github
Github repo
https://github.com/erickclasen/DMAC-BTC-Trading-Example-With-Tuning