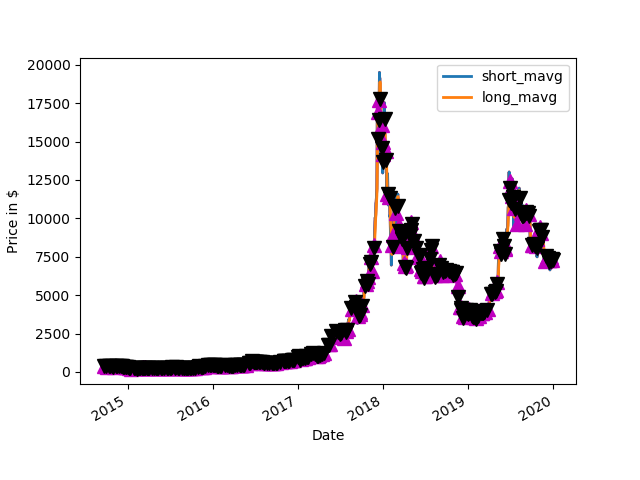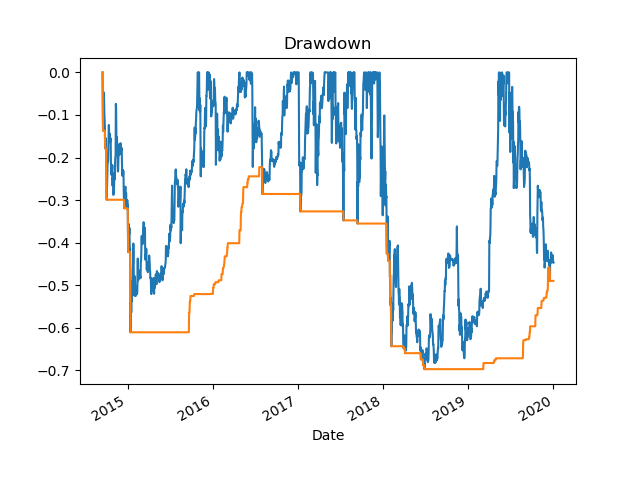
This post is an addition to the series on DMAC algorithm trading, which is simple algo trading example. I was wondering now that the S&P500 and etc, legacy market has dropped out of it’s long bull run, how would Bitcoin gains compare against the stock market?
First Post in Series to Learn More Background
Code to run this model on Github
BTC Buy and Hold -v- S&P 500 Buy and Hold
The plan: Comparing Bitcoin (BTC) gains from January 1,2010 to December 31,2019 against the bottom for stocks on March 9, 2009 to Feb 19,2020, the 400% bull run for the S&P 500. But, for some reason the Yahoo data for Bitcoin is only going back to 2014-09-16. So we are basically getting a bit short changed here on BTC and giving the S&P a long head start for nearly 5 years. (I am sure at one point in the past, I think this used to work and go back all the way to 2010 but Yahoo must have cutoff the data since I first tried this code.)
So with 5 years head start for S&P
S&P500 4x gain across history shown in the above chart 03-09-2009 to 2-19-2020
BTC 16.96x gain from 9-16-2014 to 2-19-2020
Now for a true side by side comparison
S&P 500 on 9-16-2014 closed at 1998.98
S&P 500 on 2-19-2020 closed at 3386.15
S&P 500 gain 1.69x from 9-16-2014 to 2-19-2020
So Bitcoin beats the S&P using by and hold across the same time frame by 10x.
Buy and Hold -v- DMAC Algo Trading on BTC
OK, now what about BTC HODL (Buy and Hold) gains versus optimized DMAC algorithm trading from 9-16-2014 to 2-19-2020?
HODL Gains: 16.96393901373665
Algo gains for a 1 day short and 4 day long average. This is wicked tight and it will trade like mad, so in real life, the transaction fees and slippage would eat away at this number after 10 years.
Short AVG,Long AVG,Best Bank 1 4 2244962.564086914 which is 22.4x
which is 22.4x gains. But, with fees/slippage and HODL at ~17x , HODL is really great. Beats the 4x or 1.69x depending on the time frame of the S&P 500!
It could do better
This is a simple algorithm, one of the simplest ones that can be thought of. Also, remember that the algorithm only tuned once across the entire time period. If the time period was cut up into smaller periods and the algorithm learned the market as it changed over time instead of trying to get a best fit across 5 years it would have produced more gains. The example the initial post which has it trade from Jan 1 to Dec 31 of 2019 shows in making 900K alone in one year. So an algorithm that could in theory re-optimize periodically as the market conditions change would easily beat the results of this simple algorithm. The best thing that I can think of would be a machine learning algorithm that would use differential evolution to change the parameters as time goes on. It would learn on an ensemble of random sections of random lengths of data from the past and tune the algorithm’s parameters based on learning from the data ensembles. That is just one way that comes to mind.
But, at the end of the day this is just an example. It is not always possible to predict future results from past data. It is also well known and Covid-19, The Great Recession and Black Monday in 1987 serve as examples, there will be price shocks that can upend any model in practice. The statistics of price action do not fall neatly under a bell curve but have fat tails that lead to excursions far away from the mean on occasion. One only has to look to history for this lesson and one example is the firm Long-Term Capital Management (LTCM) led by a brilliant team of folks including Nobel prize winners Merton and Scholes, two out of the men that invented the Black-Scholes option pricing formula. Fischer Black, the other man was not alive at the time that the prize was awarded. Some credit for the formula rests with Ed Thorp as well, at least a way in the backstory. Ed Thorp had basically the same kind of formula running on convertible bonds, not a far jump to options pricing. This is all outlined in the great book The Quants by Scott Patterson. Quants was one of the seeds that led me to pursue trading, specifically algorithmic trading a few years after I read it.
Lessons To Be Learned
So there were brilliant guys were at the heart of LTCM but, due to high leverage and a divergence of their models from reality when the Russian government defaulted on their debt, the firm crashed and burned financially. It happened fast as they and others holding similar positions in the market all simultaneously unwound those positions. LTCM was stuck holding a lot of positions trying to offload into a market without many buyers, low liquidity, and the worst part of it, being leveraged heavily 30-40:1 was the real problem. They were effectively running backwards selling off, what normally one would not want to be forced to sell off, being highly leveraged it quickly ran out of margin and went effectively bankrupt. The pieces of LTCM were bought up by 13 banks and this averted a disaster that could have been equal to 2008 if the banks had not carved up the LTCM carcass among themselves. It could have easily had a domino effect on the rest of the banks and the global market much like what happened in 2008. LTCM as brilliant as it began, ended as a good lesson for the future, if only heeded and rocked the markets for a while and the shock cascaded. Then the lesson seems to get lost in general, although I imagine some took it to heart, in general history repeated itself about a decade later in terms of the next financial crisis which was the same thing only an order of magnitude larger. 2008 was not containable by some short term heroics between the Fed and 13 banks as in the case of LTCM.
https://www.pbs.org/wgbh/nova/transcripts/2704stockmarket.html
https://www.pbs.org/wgbh/nova/stockmarket/
https://www.pbs.org/wgbh/pages/frontline/warning/themes/ltcm.html


Raw Dump
(base) erick@OptiPlex-790 ~/python/simple-strat $ python simple-strat-loop-backtest-2010-2019.py
Get Data
Run Model
Short AVG,Long AVG,Best Bank 1 1 100000.0
Short AVG,Long AVG,Best Bank 1 2 1495120.7946777344
Short AVG,Long AVG,Best Bank 1 3 1845316.8991088867
Short AVG,Long AVG,Best Bank 1 4 2244962.564086914
 signal short_mavg long_mavg positions
Date
2014-09-16 0.0 457.334015 457.334015 NaN
2014-09-17 0.0 424.440002 440.887009 0.0
2014-09-18 0.0 394.795990 425.523336 0.0
2014-09-19 0.0 408.903992 421.368500 0.0
2014-09-20 0.0 398.821014 406.740250 0.0
2014-09-21 1.0 402.152008 401.168251 1.0
2014-09-22 1.0 435.790985 411.417000 0.0
2014-09-23 1.0 423.204987 414.992249 0.0
2014-09-24 0.0 411.574005 418.180496 -1.0
2014-09-25 0.0 404.424988 418.748741 0.0
2014-09-26 0.0 399.519989 409.680992 0.0
2014-09-27 0.0 377.181000 398.174995 0.0
2014-09-28 0.0 375.467010 389.148247 0.0
2014-09-29 1.0 386.944000 384.778000 1.0
2014-09-30 1.0 383.614990 380.801750 0.0
2014-10-01 0.0 375.071991 380.274498 -1.0
2014-10-02 0.0 359.511993 376.285744 0.0
2014-10-03 0.0 328.865997 361.766243 0.0
2014-10-04 0.0 320.510010 345.989998 0.0
2014-10-05 0.0 330.079010 334.741753 0.0
2014-10-06 1.0 336.187012 328.910507 1.0
2014-10-07 1.0 352.940002 334.929008 0.0
2014-10-08 1.0 365.026001 346.058006 0.0
2014-10-09 1.0 361.562012 353.928757 0.0
2014-10-10 1.0 362.299011 360.456757 0.0
2014-10-11 1.0 378.549011 366.859009 0.0
2014-10-12 1.0 390.414001 373.206009 0.0
2014-10-13 1.0 400.869995 383.033005 0.0
2014-10-14 1.0 394.773010 391.151505 0.0
2014-10-15 0.0 382.556000 392.153252 -1.0
... ... ... ... ...
2019-12-03 0.0 7320.145508 7409.014038 0.0
2019-12-04 0.0 7252.034668 7329.615234 0.0
2019-12-05 1.0 7448.307617 7335.619019 1.0
2019-12-06 1.0 7546.996582 7391.871094 0.0
2019-12-07 1.0 7556.237793 7450.894165 0.0
2019-12-08 1.0 7564.345215 7528.971802 0.0
2019-12-09 0.0 7400.899414 7517.119751 -1.0
2019-12-10 0.0 7278.119629 7449.900513 0.0
2019-12-11 0.0 7217.427246 7365.197876 0.0
2019-12-12 0.0 7243.134277 7284.895142 0.0
2019-12-13 1.0 7269.684570 7252.091431 1.0
2019-12-14 0.0 7124.673828 7213.729980 -1.0
2019-12-15 0.0 7152.301758 7197.448608 0.0
2019-12-16 0.0 6932.480469 7119.785156 0.0
2019-12-17 0.0 6640.515137 6962.492798 0.0
2019-12-18 1.0 7276.802734 7000.525024 1.0
2019-12-19 1.0 7202.844238 7013.160645 0.0
2019-12-20 1.0 7218.816406 7084.744629 0.0
2019-12-21 0.0 7191.158691 7222.405518 -1.0
2019-12-22 1.0 7511.588867 7281.102051 1.0
2019-12-23 1.0 7355.628418 7319.298096 0.0
2019-12-24 0.0 7322.532227 7345.227051 -1.0
2019-12-25 0.0 7275.155762 7366.226318 0.0
2019-12-26 0.0 7238.966797 7298.070801 0.0
2019-12-27 1.0 7290.088379 7281.685791 1.0
2019-12-28 1.0 7317.990234 7280.550293 0.0
2019-12-29 1.0 7422.652832 7317.424561 0.0
2019-12-30 0.0 7292.995117 7330.931641 -1.0
2019-12-31 0.0 7193.599121 7306.809326 0.0
2020-01-01 0.0 7200.174316 7277.355347 0.0

[1933 rows x 4 columns]
 BTC-USD holdings cash total returns
Date
2014-09-16 0.0 0.0 100000.0 100000.0 NaN
2014-09-17 0.0 0.0 100000.0 100000.0 0.0
2014-09-18 0.0 0.0 100000.0 100000.0 0.0
2014-09-19 0.0 0.0 100000.0 100000.0 0.0
2014-09-20 0.0 0.0 100000.0 100000.0 0.0
 BTC-USD holdings cash total returns
Date
2019-12-28 731799.023438 731799.023438 1.515663e+06 2.247462e+06 0.001243
2019-12-29 742265.283203 742265.283203 1.515663e+06 2.257928e+06 0.004657
2019-12-30 0.000000 0.000000 2.244963e+06 2.244963e+06 -0.005742
2019-12-31 0.000000 0.000000 2.244963e+06 2.244963e+06 0.000000
2020-01-01 0.000000 0.000000 2.244963e+06 2.244963e+06 0.000000
Portfolio Plot
Sharpe Ratio 1.5767602439593071
Compound Annual Growth Rate (CAGR) 0.7067353770154898
HODL Gains: 16.96393901373665
